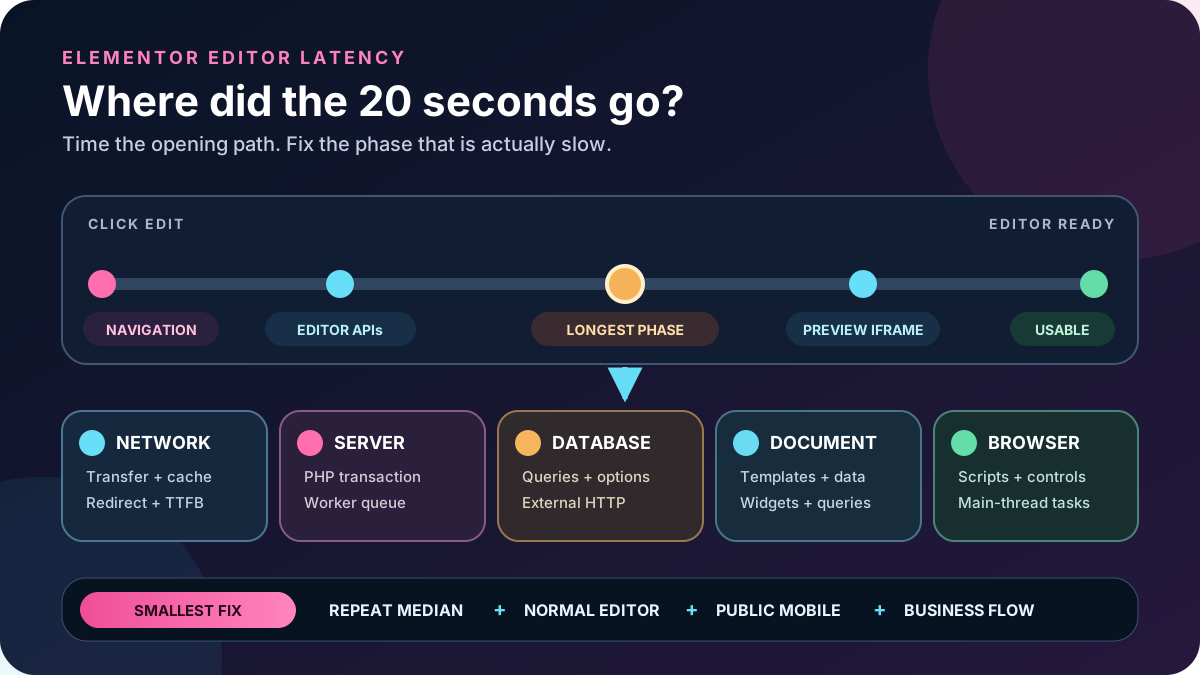
You click Edit with Elementor, wait 20, 30, or even 60 seconds, and then the editor finally becomes usable. The live page may be fast, and the editor may feel responsive once open. The expensive part is the journey from the click to a ready editor.
This guide explains why Elementor takes 20+ seconds to open and how to speed up the editor by timing that journey. For mixed symptoms, start with the broader Elementor editor loading guide. An editor that never opens belongs in the post-Safe-Mode diagnosis. If the canvas opens but the left panel keeps spinning, use the widget-panel workflow. Here, the complete editor eventually loads, but too slowly.
Quick answer: Measure three identical editor openings on staging and use the median. In Chrome DevTools, locate the delay in the initial document, an API request, preview iframe, asset transfer, or browser main thread. Connect that phase to server, database, worker, add-on, optimization, or page evidence. Apply one narrow change and keep it only if repeated timing, the editor, and business-critical frontend all pass.
| What consumes the delay | Most useful lead | Next evidence |
|---|---|---|
| Initial editor document has long Waiting (TTFB) | PHP, database, origin, or worker queue | Host trace and logs at the same timestamp |
One REST or admin-ajax.php call is long | Plugin hook, query, permission, or external API | Request URL, response, component, and server trace |
| Preview iframe starts or finishes late | Page data, template, dynamic query, or server rendering | Blank-page comparison and iframe request timing |
| Large scripts spend time downloading | Network, CDN, cache, or asset transformation | Transfer size, cache headers, and controlled bypass |
| Network is quiet but the browser is busy | JavaScript, controls, add-ons, or a large document | Performance trace and long tasks |
| Only the normal browser profile is slow | Extension, local security, stored data, or proxy | Clean-profile comparison with extensions off |
Work on staging and take a restorable files-and-database backup first. These tests can change editor or visitor behavior. Do not run an unreviewed database cleanup, disable security globally, or rebuild a production page to test a theory. Require an immediate rollback for every change.
1. Define what “open” and “ready” mean
Start when the browser begins navigation after you click Edit with Elementor. Finish when the canvas and panel respond and you can select an element without a loading overlay. A stopwatch cannot locate the cause, but it makes before-and-after tests comparable.
- Choose one affected page and create one genuinely blank Elementor page on staging.
- Use the same administrator, computer, network, browser window size, and DevTools settings.
- Open each page three times and record the median, not the fastest result.
- Label cold tests, where browser cache is deliberately disabled, separately from normal warm openings.
- Record the date, time, timezone, Elementor/Core/Pro versions, and current plugin state.
Do not purge every cache between ordinary runs. If the blank page also takes 22 seconds, start with shared browser, server, add-on, and initialization work. If it opens in four seconds but one landing page takes 28, preserve the global stack and investigate that document, templates, and data.
2. Record the editor opening in the Network panel
Open Chrome DevTools before navigation. In Network, enable Preserve log, clear old requests, keep throttling off, and load once. Chrome’s Timing tab separates queueing, connection work, Waiting (TTFB), and download. TTFB includes latency and response preparation, so it is a direction, not a database verdict.
- Sort by duration and inspect the initial editor document, Fetch/XHR, REST routes,
admin-ajax.php, JavaScript, and the preview iframe. - For each long request, record its method, final URL, status, start time, duration, TTFB, transfer size, initiator, and a redacted response preview.
- Check redirects. A request can spend time reaching a final
200after an unnecessary redirect or login round trip. - Look for request overlap. Several 5-second requests in parallel do not automatically equal 15 seconds; the request blocking the ready state matters.
- Export a HAR only when support needs it, then remove cookies, nonces, query data, and private response content before sharing.
Use Disable cache for a clearly labeled cold-load comparison, not as the default diagnosis. If normal openings are slow while the cold and warm waterfall are nearly identical, asset caching may not own the delay.
3. Use Server-Timing when the host provides it
Some platforms add a Server-Timing response header. Its metrics can expose application, database, cache, or other backend durations in browser developer tools. Metric names are implementation-specific: db, app, or cache only mean what that platform documents.
If a 12-second request shows 10 seconds in a documented application or database metric, you have a strong handoff. An absent header does not prove the backend was quick; no metrics were exposed. If reported phases explain only part of TTFB, ask whether worker queueing, proxy time, or another layer occurs first.
4. Check whether the browser spends the missing seconds
When requests finish but the editor remains frozen, record a load in DevTools Performance. Inspect the Main thread between the last important response and the ready editor. Wide tasks and repeated red long-task markers indicate JavaScript, style, layout, or rendering work rather than a network wait.
- Repeat the test in a clean current browser profile or a private window where extensions are actually disabled.
- Close unrelated tabs and background applications, but retain the original measurement so the improvement is quantified.
- Compare the same account and page on another suitable desktop computer. Elementor editing is desktop-only; mobile testing belongs to frontend verification.
- In the trace, follow the longest call stacks to an Elementor, add-on, analytics, password-manager, translation, ad-blocking, or security-extension file.
- If the clean profile is fast, restore extensions one at a time. Do not erase the user’s entire browser profile as the first fix.
If two devices show the same long server request, buying a faster laptop will not fix it. If the Network waterfall completes quickly on both but one device spends 15 seconds on the main thread, the local browser or document-rendering cost deserves attention.
5. Correlate slow TTFB with PHP workers and server capacity
Elementor’s authenticated editor requests are dynamic. Full-page caching that makes logged-out pages fast generally does not remove the PHP and database work required by an administrator. That is why a fast homepage does not clear the server.
A PHP worker is occupied until its uncached request finishes; later requests wait when all workers are busy. Ask the host for queue depth, request traces, CPU and memory pressure, slow logs, and 502, 503, or 504 events at your timestamp. Compare quiet and busy periods.
Interpret capacity carefully: a queue causes waiting, but one expensive plugin transaction may create the queue. Fix that request first. Add workers only when legitimate concurrency still exceeds optimized capacity and the server has enough CPU and RAM.
Elementor currently lists 256 MB WordPress memory for Core and Pro alone, 512 MB recommended, and 768 MB for best performance. That is compatibility guidance, not a latency promise. Increase memory only when the effective request is constrained or logs show exhaustion; per-request memory differs from worker concurrency.
6. Attribute database queries and external HTTP calls
On staging, Query Monitor can group queries by component and expose PHP errors, hooks, and HTTP API calls. Look for one slow query, repeated work from one plugin, or an outbound request waiting for a licensing, feed, CRM, analytics, or update service.
- Capture the baseline without the profiler and note the long browser request.
- Enable Query Monitor only for the controlled diagnosis and reload the same URL.
- Match the component and call stack to the slow query or external call.
- Confirm by changing only that component on staging, then measure without the profiler.
- Remove or restrict diagnostic tooling after the investigation.
Profilers add overhead, so compare ownership more than absolute milliseconds. Do not bulk-delete transients, options, or tables because a scanner says “overhead.” An uncached external request makes WordPress wait; its owner may need a timeout, background job, vendor correction, or safe cache.
7. Test the page document, templates, queries, and dynamic data
A large page creates work while Elementor reads its document, PHP prepares data, the browser parses it, the iframe renders, and dynamic widgets query content. Nested containers, Loop Grids, product queries, ACF fields, shortcodes, global elements, and Theme Builder conditions are suspects only when comparisons support them.
- Compare the blank page, a small normal page, the slow page, and a Theme Builder template.
- Duplicate the slow page on staging and remove one evidence-backed region at a time, starting with dynamic loops, shortcodes, custom HTML/JavaScript, and third-party widgets.
- Watch whether the same request shrinks or whether browser processing after the request changes.
- Use Elementor’s Structure view to find unnecessary nesting, then simplify a copy while preserving responsive behavior.
- Test template conditions and representative data. A query may be cheap with ten posts and slow with thousands of products or a complex meta query.
WordPress stores revisions and supports a retention limit. They increase database size, but their existence does not prove an opening delay. Back up, count them, identify a related query or workflow, and test retention on staging. Do not trade recovery history for an unmeasured claim.
8. Control widget packs and editor-only add-on work
Third-party add-ons can register widgets, controls, integrations, and editor-only scripts. Editor initialization may load control code even when the page does not visibly use every feature. Prioritize tests using the file path, Performance stack, last-change timeline, and System Info compatibility data.
- Run a plugin and feature audit on staging.
- Disable one add-on module named by the trace and repeat the three-opening median.
- If the result is unchanged, restore it before testing the next module.
- Use Elementor’s Element Manager usage scan before disabling elements.
- Verify every template and page that depends on the removed widget or control.
Elementor warns that disabling a used element can break it. Also distinguish editor work from frontend assets: an unused native widget may add nothing widget-specific to a public page, while a third-party pack can still register editor controls. Request evidence beats plugin counts.
9. Verify versions and effective system values
Download System Info from Elementor > Editor > System. Record platform and plugin versions, theme, browser, PHP and WP memory, Max Input Vars, active plugins, compatibility tags, element usage, and logs. Effective web-request values matter more than a setting edited in the wrong file.
If slowness began after an update, compare timestamps and changelogs. Keep Core and Pro compatible, check add-on support, and follow current guidance. Elementor presently recommends backup, staging, compatibility checks, and Pro before Core when updating both; re-check release notes and order before maintenance. Use the Elementor update checklist to prepare rollback.
Meeting minimum versions removes known incompatibility, but it does not identify a 20-second phase. Likewise, changing max_input_vars, execution time, or memory without an error or truncated request can create risk without improving the opening time.
10. Test Cloudflare and optimization on the exact editor path
Cloudflare Rocket Loader defers JavaScript, and Elementor documents that it can delay or break editor scripts. JavaScript delay, combination, minification, CDN rewriting, WAF challenges, and aggressive authenticated caching deserve a controlled bypass when the waterfall or transformed response points to them.
- Compare one opening with the specific optimization bypassed for Elementor’s authenticated editor URL and dependencies.
- Check response headers and confirm logged-in/admin HTML is not returned as an edge cache hit.
- For Rocket Loader, prefer a scoped Cloudflare Configuration Rule or documented script exclusion rather than disabling it for the whole public site.
- Match any
403, challenge, or rate limit to the exact WAF rule and request path. - After changing the rule, clear only the relevant cache and repeat both editor and logged-out tests.
If the request durations do not change under the controlled bypass, restore the optimization. A generic cache purge that happens to precede one faster load is not proof; use repeated timings and the same request phase.
11. Choose the smallest fix that changes the measured phase
| Proven cause | Narrow fix | Proof to retain |
|---|---|---|
| One add-on control script creates long tasks | Disable that module, update it, or replace the widget | Trace and median before/after |
| One plugin’s query or external call dominates | Fix, cache, defer, or remove that call | Component trace plus request timing |
| Workers queue during legitimate concurrency | Optimize slow transactions, then right-size capacity | Queue and APM comparison |
| Only one large document is slow | Simplify the proven region or query on its staging copy | Blank/page and section comparison |
| Rocket Loader transforms editor scripts | Exclude the authenticated editor path or dependencies | Response and waterfall comparison |
| Browser extension owns the delay | Disable or scope that extension for the site | Clean-profile Performance trace |
Write down the rollback for each action: re-enable the module, restore the previous rule, revert the compatible plugin pair, restore the database, or replace the original staging page. Change one variable at a time. If a change does not improve the same phase across repeated tests, reverse it.
12. Verify editor, frontend, mobile, and business behavior
A faster editor is not a complete fix if it removes widgets, breaks dynamic output, or changes authenticated flows. Repeat the original three-run median in a fresh normal session, not Safe Mode, and preserve the final waterfall or trace.
- Open, edit, update, close, and reopen both a blank page and the formerly slow complex page.
- Test a second authorized user or role, including any role restrictions on Elementor elements.
- Review PHP, application, browser, and WAF logs for new errors.
- Visit the affected page logged out on desktop and mobile; check responsive layout, fonts, animations, navigation, and console.
- Test relevant headers, footers, popups, forms, search, login, membership, booking, cart, checkout, payment, email, CRM, analytics, and webhook flows.
- Compare normal public performance separately. Do not claim the live frontend became faster unless its own metrics improved.
13. Prevent the next 20-second editor opening
- Keep a small benchmark page and record editor-opening medians before and after updates.
- Maintain a dependency map for add-on widgets, dynamic fields, templates, forms, and business integrations.
- Remove unused add-on modules only after an element-usage and template review.
- Keep authenticated editor/admin paths outside visitor-only cache and JavaScript-delay rules.
- Monitor slow PHP transactions, external calls, database queries, worker queues, and resource saturation.
- Set a deliberate revision policy that preserves recovery needs; never make cleanup a substitute for diagnosis.
- Test Core, Pro, theme, and add-on changes on staging with a verified rollback.
Research sources
This workflow was checked against Elementor’s slow editor troubleshooting, current system requirements, System Info documentation, Element Manager guidance, safe update guidance, and backup and staging advice.
Timing and server analysis use the Chrome Network reference, Chrome Performance guide, Server-Timing reference, Query Monitor documentation, WordPress HTTP performance guidance, and a managed-host explanation of PHP-worker queueing.
The CDN checks follow Elementor’s Rocket Loader guidance, Cloudflare’s scoped exclusion guidance, and Cloudflare’s authenticated dynamic-content guidance. Community reports supplied problem wording only; their proposed fixes were not treated as proof.
Frequently asked questions
Is 20 seconds normal for Elementor to open?
No universal time fits every stack, but a repeatable 20+ second opening is worth investigating. The useful question is which request or browser phase consumes the delay and whether a blank page shares it.
Why is the frontend fast when the Elementor editor is slow?
A logged-out page may be served from full-page or edge cache, while the authenticated editor needs dynamic PHP, database, REST, iframe, control, and browser work. The two paths overlap, but they are not the same. Diagnose and verify their performance separately.
Will increasing WordPress memory speed up Elementor?
It helps when the effective request is below Elementor’s requirement or logs show memory exhaustion. It does not automatically shorten a slow query, external API call, PHP-worker queue, script download, or browser long task. Confirm the current effective PHP and WordPress limits, then measure the same phase.
Do too many revisions make the Elementor editor slow?
Revisions use database storage and can matter in a specific workflow, but their count alone does not prove the opening delay. Identify a revision-related query or data path, back up the database, test a sensible retention policy on staging, and preserve enough history for recovery.
Should I disable widget packs, caching, or Cloudflare?
Only in a controlled, reversible test. Disable the module or exact optimization named by the trace, then repeat the baseline. If it is proven, keep a scoped fix and verify every dependent widget and public flow. Avoid global cache, WAF, or security shutdowns.
Still waiting 20+ seconds for Elementor? AbdullahWP can correlate the browser waterfall with WordPress, database, PHP-worker, add-on, and Cloudflare evidence, then implement the smallest verified fix on staging. Request a focused Elementor performance diagnosis.