Installing a cache plugin does not guarantee that every WordPress request becomes fast. The plugin may be active while the tested page is a cache miss, a rule may bypass the request, or the page may be served quickly but still ship oversized images, fonts, CSS, JavaScript, and HTML. Logged-in sessions, carts, checkout, search, REST requests, and personalized pages may correctly skip full-page cache and expose a slow PHP or database path.
This guide shows how to prove which cache layer answered, separate server wait from browser work, and repair the smallest measured bottleneck. Success means public and dynamic workflows improve without serving private or stale content.
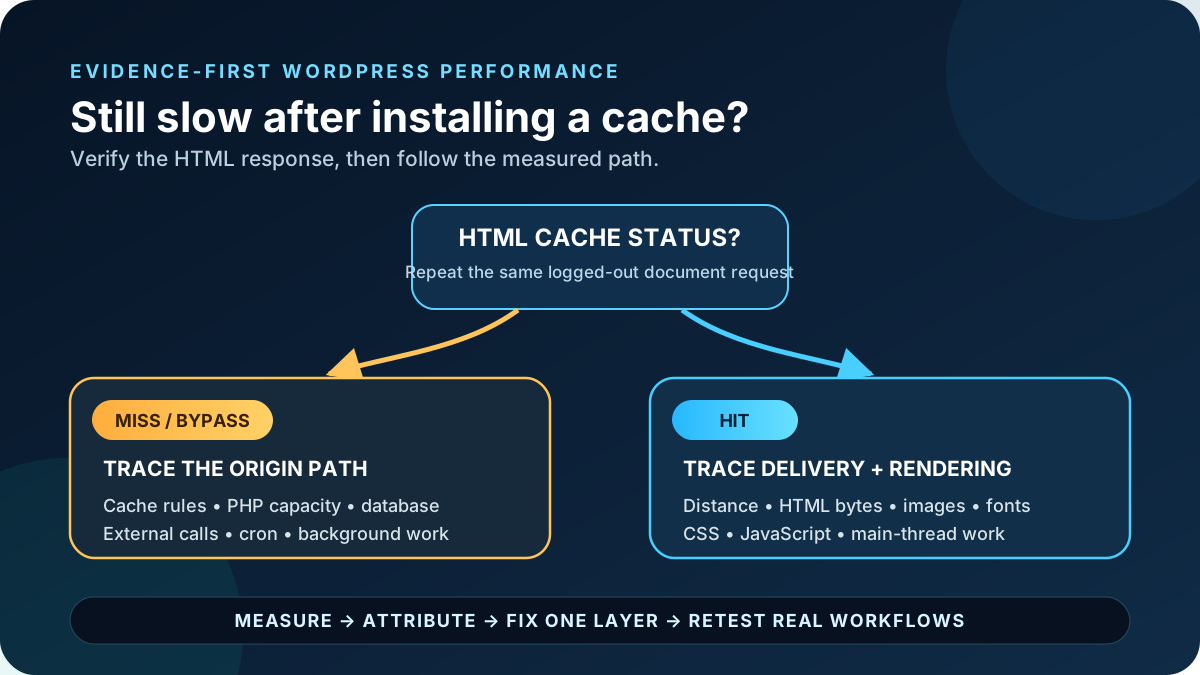
Quick answer: Test the same canonical URL while logged out, inspect the HTML document’s response headers, and repeat the request after the cache is warm. A MISS or BYPASS points to cache coverage, cookies, query strings, exclusions, or fragmentation. A slow HIT points beyond PHP page generation: network distance, a large response, render-blocking resources, images, fonts, or JavaScript. If only uncached pages are slow, profile PHP, database queries, autoloaded options, external calls, background work, and server capacity instead of installing another cache plugin.
Match the slow result to the right layer
| Evidence | Likely bottleneck | First useful action |
|---|---|---|
Logged-out HTML is a cache MISS every time | Page cache never stores or reuses that variant | Check eligibility, cookies, query strings, exclusions, and competing cache owners |
First request is MISS; repeats become HIT | Normal cold-cache generation or weak warm-up | Compare cold and warm TTFB; improve origin if the first visitor still matters |
HTML is a HIT, but TTFB varies by location | Distance, DNS/TLS, CDN routing, or edge coverage | Test several regions and confirm whether HTML, not only assets, is cached at the edge |
| HTML arrives quickly; the page appears late | CSS, fonts, images, JavaScript, or main-thread work | Inspect the waterfall, LCP phases, and Performance trace |
| Logged-out page is fast; logged-in, cart, search, or API is slow | Uncached PHP, database, external API, or capacity | Profile that exact dynamic request; do not force unsafe page caching |
| Site slows during imports, backups, scans, or queue processing | CPU, disk, database, PHP-process, cron, or background contention | Match resource graphs and job logs to the slow time |
| One template is slow while similar pages are fast | Template-specific query, widget, media, shortcode, or cache variant | Compare the two requests and attribute the extra work |
Protect the site before testing: take a restorable database-and-files backup and use staging for plugin, theme, PHP, database, or cache-rule changes. Record current settings and exclusions. Staging helps attribution, but different traffic, cache warmth, data, integrations, and capacity can make it faster than production.
1. Build a repeatable baseline before changing settings
“The site feels slow” is not reproducible. Choose representative URLs and actions: homepage, article, landing page, product, search, login, cart, checkout, account, form, and an important API-backed feature. Mark which should be public-cacheable and which must remain dynamic.
- Open a private window so an administrator cookie does not bypass page cache.
- Use the canonical HTTPS URL without accidental campaign parameters.
- In Chrome DevTools, open Network, reload, and select the document request.
- Record status, final URL, TTFB or Waiting for server response, download time, transferred bytes, response headers, location, device profile, and time.
- Repeat at least three times. Label cold and warm runs; use the median, not the best result.
- Measure mobile and logged-in business workflows separately from the public-page result.
Chrome’s Disable cache option disables its local browser cache while DevTools is open; it does not necessarily bypass a WordPress, host, proxy, or CDN cache. Use response headers to identify the upstream layer.
2. Prove whether the HTML is a cache hit
An “enabled” badge is configuration, not delivery evidence. Inspect the HTML document, not an image or CSS file. The useful header may be Age, Cache-Status, CF-Cache-Status, X-Cache, X-LiteSpeed-Cache, or host-specific. Check provider documentation because status meanings vary.
Request the same logged-out URL twice without purging. A MISS followed by a HIT normally means the first request stored a variant. Repeated misses suggest no storage, eviction, or a changing cache key. Increasing Age on hits supports shared-cache reuse. Cache-Control describes policy; it does not prove a hit.
Keep a test ledger: URL, login state, query string, device, region, cache header, TTFB, HTML bytes, and timestamp. Change one setting, purge the affected layer, warm the URL, and repeat. Otherwise a naturally faster warm run can look like a fix.
3. Fix cache bypass and fragmentation without caching private pages
Full-page cache works best when many visitors can receive identical HTML. WordPress cookies, WooCommerce sessions, membership state, currency or language choices, device variants, query parameters, and custom application logic can split one URL into many variants or make it ineligible. That protects correctness, but it lowers the hit ratio.
- Test logged out: user cookies commonly bypass public HTML cache.
- Review exclusions: find overly broad path, cookie, user-agent, and query-string rules, while preserving necessary ones.
- Choose one page-cache owner: duplicated rules and purge systems make status and freshness unpredictable.
- Normalize harmless variants carefully: never ignore a parameter that changes price, language, access, search, or content.
- Check mobile separation: create mobile HTML variants only when markup differs; responsive CSS normally reuses one page.
- Warm important URLs: warm-up reduces cold misses but cannot repair a slow origin or aggressive eviction.
WooCommerce documents that Cart, Checkout, and My Account must remain dynamic, and customer cookies can require exclusions. The correct target is a fast uncached path for those pages—not a forced hit that risks showing the wrong cart or account. Test add-to-cart, coupon, shipping, payment, order confirmation, login, logout, password reset, and account data after any rule change.
4. Diagnose a slow cache hit
A page-cache hit avoids most WordPress PHP and database generation, but it does not make the network or browser free. First split the document request into connection and waiting time versus content download. Then split page rendering into discovery, download, and main-thread work.
Check distance, redirects, and edge coverage
Test from the audience’s main regions. A cache hit at the origin data center can still be far from a visitor. A CDN may cache images, CSS, and JavaScript while forwarding every HTML request to the origin. Confirm the cache status on the document itself and compare regions. Remove avoidable redirect chains such as HTTP to HTTPS to a different host, but preserve the one intended canonical redirect.
Cloudflare’s official cache documentation explains that CF-Cache-Status identifies its cache result and that Age is present on responses served from its cache. That evidence applies only to the Cloudflare layer and only when the resource is eligible; it does not reveal a hidden origin cache by itself.
Check a large or slowly streamed HTML response
If waiting is low but Content Download is high, inspect transferred HTML bytes, compression, connection quality, and whether the response stalls. Huge menus, product grids, hidden responsive duplicates, page-builder wrappers, inline CSS, schema, and application state can make cached HTML heavy. Reduce the generating template rather than hiding the symptom with a longer cache lifetime.
Check images, fonts, CSS, JavaScript, and the main thread
If HTML arrives quickly but useful content appears late, page generation is no longer the main problem. Use the waterfall and a Performance recording to identify the LCP element, late resource discovery, slow downloads, render-blocking styles, font waits, or long JavaScript tasks. A cache plugin may offer minification, delay, or image options, but enabling all of them at once can create regressions and conceal the responsible resource.
- Serve responsive, appropriately sized images; do not lazy-load the actual LCP image.
- Load only the font families and weights in use, and preload only a proven critical font.
- Trace unused or blocking CSS to its owner before unloading it.
- Reduce third-party tags, sliders, chat, maps, and embeds that run before primary content.
- Use the initiator and main-thread trace to attribute expensive JavaScript; a smaller file is not automatically cheaper to execute.
For Elementor pages, the Elementor LCP optimization guide separates server time, resource discovery, download, and render delay. Keep that page-level work separate from the cache-hit diagnosis here.
5. Profile the uncached WordPress origin
When a public hit is fast but a legitimate miss, cart, account, search, form, REST request, or logged-in page is slow, the origin is the bottleneck. Page cache was masking it. Measure one slow request with the host’s application performance monitor or a controlled staging profiler.
Query Monitor can group database queries by plugin, theme, or function and show PHP errors, HTTP API calls, scripts, styles, and memory. Its view is normally available to an administrator, so it changes the login state and often bypasses full-page cache. Use it for attribution, not as the public page-speed score. On production, use one host-supported APM tool during a limited window; simultaneous profilers can add overhead and conflicting data.
Check PHP capacity and queueing under load
Hosts call them PHP workers, processes, or threads. Each uncached request occupies one while WordPress runs. If all are busy, later requests wait even when a single isolated test is acceptable. Compare slow periods with PHP queue, CPU, memory, database load, slow-request logs, and 502/503/504 errors. More workers can improve concurrency only when the server has capacity; they do not make one inefficient request cheaper and can increase database contention.
Attribute database queries and autoloaded options
Look for slow or duplicate queries, large result sets, missing indexes supported by the responsible plugin, repeated metadata lookups, and options loaded on every request. WordPress Site Health flags autoloaded options above its performance threshold, but size alone does not identify which records are safe to change. Export the database and establish ownership before cleanup. The WordPress database bloat guide covers that narrower process.
A persistent object cache can reduce repeated database retrieval on uncached requests; it is not a replacement for page cache and it cannot fix slow external APIs, expensive uncached queries, or front-end JavaScript. Use the WordPress object cache and Redis guide only after measurement shows reusable database work and the host supports a persistent backend.
Find synchronous external HTTP calls
A theme or plugin may wait for licensing, exchange rates, feeds, geolocation, CRM, analytics, or another API while building the response. Query Monitor or APM can expose the URL, component, duration, and failure. Repair the integration, add a sensible timeout, or have its developer cache reusable results with a suitable lifetime. Do not block all outbound requests or indefinitely cache customer-specific or time-sensitive data.
The WordPress plugin audit checklist helps map queries, assets, HTTP calls, cron events, and business dependencies before a plugin is replaced. Plugin count alone is not a performance measurement.
6. Correlate cron and background work with slow periods
WordPress checks for due WP-Cron events on page loads. Imports, backups, malware scans, image processing, search indexing, email queues, reports, and WooCommerce Action Scheduler jobs can then compete for PHP, CPU, disk, and database capacity. A page cache can reduce visitor-triggered WordPress requests, but it does not make heavy background work inexpensive.
- Match the slow timestamp to WP-Cron, Action Scheduler, backup, scan, import, and host resource logs.
- Identify the hook or job owner and its duration; do not delete a queue just to lower its count.
- Run large jobs in controlled batches and outside peak business traffic when the tool supports it.
- Use one tested system scheduler if reliable timing is needed; disabling normal WP-Cron without a replacement stops scheduled work.
- Verify orders, subscription renewals, emails, webhooks, and cleanups after any scheduler change.
Use the dedicated WordPress cron backlog guide when due events are late or queues are growing. This article’s boundary is performance contention, not general missed-schedule repair.
7. Apply the smallest fix supported by evidence
| Measured cause | Smallest first change | Proof to collect |
|---|---|---|
| Public page is always bypassed by an unnecessary rule | Narrow that one exclusion or cache-key condition | Correct warm HIT, unchanged personalized workflows |
| Cold origin is slow; warm hit is fast | Profile one cold request and improve its dominant call/query | Lower cold median without relying on preloading |
| Dynamic requests queue at peak traffic | Shorten the proven slow transaction; then size PHP/server capacity | Lower queue time and error rate at representative concurrency |
| One plugin owns most PHP/query/API time | Correct its setting, data shape, integration, or version on staging | Same request with lower component time and intact feature output |
| HTML hit is fast; LCP is late | Fix the dominant LCP phase or render gate | Earlier LCP with stable layout and working interactions |
| Background job saturates resources | Repair, batch, reschedule, or resource-limit that job | Normal foreground latency while required jobs still complete |
Do not stack a second optimization plugin, delete database rows, raise every PHP limit, disable all JavaScript, or upgrade hosting before attribution. Some sites genuinely need more capacity, but a larger server can hide an inefficient query or external timeout until traffic grows again.
Verify the repair and keep a rollback path
- Purge only the layer affected by the change, then record one cold request and at least three warm requests.
- Test the canonical page logged out on desktop and a throttled mobile profile from an audience-relevant region.
- Sign in with a non-administrator test account and verify account content, access control, and logout.
- Complete the real business path: search, form delivery, add-to-cart, coupon, shipping, checkout, payment callback, order email, membership, booking, or other critical flow.
- Check the PHP/server log, HTTP error rate, resource graphs, cron or action queue, and cache hit ratio during a representative period.
- Compare medians, not one best score, and review field performance after enough real-user data accumulates.
If a regression appears, restore the recorded cache rule or plugin settings, revert the specific code or component change, and restore database data only when that data was modified. A full database rollback on an active store can erase new orders, users, and submissions. Prevention is simple: name one owner for each cache layer, document dynamic exclusions, monitor cached and uncached URLs, schedule heavy jobs deliberately, and repeat the same performance baseline after updates.
Success: repeat public requests show the intended cache behavior; cold and dynamic requests meet an agreed response target; mobile content renders promptly; login, forms, cart, checkout, and scheduled work remain correct; and the improvement persists during normal traffic rather than only in one warm desktop test.
Official and primary sources
- WordPress performance optimization
- WordPress caching overview
- WordPress performance monitoring and profiling
- WordPress HTTP API performance guidance
- WordPress Plugin Handbook: WP-Cron
- WordPress Core: autoloaded options and Site Health
- Query Monitor on WordPress.org
- WooCommerce caching exclusions
- Chrome DevTools Network reference
- web.dev: Time to First Byte
- web.dev: Optimize Largest Contentful Paint
- web.dev: Optimize long JavaScript tasks
- Cloudflare cache response headers
- Kinsta documentation: PHP requests and concurrency
Frequently asked questions
Does a slow site mean the cache plugin is not working?
No. Confirm the HTML response header first. The plugin may correctly serve a hit while the browser waits on images, fonts, CSS, JavaScript, or third parties. It may also correctly bypass a cart, account, logged-in, or personalized request that depends on a slow origin.
Why can TTFB still be slow on a cache hit?
TTFB includes redirects, connection setup, network round trips, and the wait for the response. A hit on a distant origin, an overloaded cache layer, a redirect chain, weak edge coverage, or a large delay before the cached response starts can still produce slow TTFB. Compare locations and the document’s headers.
Why is WordPress slower when I am logged in?
Logged-in HTML is commonly excluded from full-page cache because it includes user-specific controls or data. That exposes PHP, database queries, admin-bar assets, plugins, and external calls. Profile the logged-in request; do not remove the exclusion unless the response is proven identical and contains no private state.
Should I install another cache or optimization plugin?
Not before measuring. Two tools may both alter page cache, minification, lazy loading, JavaScript timing, or purge behavior. That adds cache variants and makes rollback harder. Keep one documented owner per function and add a tool only for a measured gap it uniquely solves.
When is a hosting upgrade the correct fix?
Upgrade or resize when representative monitoring shows sustained CPU, memory, I/O, database, or PHP concurrency limits after expensive requests and background jobs have been attributed. Validate the change under realistic traffic. More capacity is useful, but it should not replace fixing a repeatable slow query, timeout, or runaway job.
Need the bottleneck traced across every layer?
AbdullahWP can audit cache headers, CDN and origin behavior, PHP and database work, scheduled jobs, and browser rendering as one system—then verify the result against the workflows that earn leads or sales. Review the WordPress speed and performance services.