A fast homepage does not prove that WordPress itself is fast. Page cache can serve a logged-out page without running most of WordPress, while wp-admin still has to authenticate the user, load plugins, query fresh data, run admin hooks, and sometimes start background work. That is why the dashboard can take ten seconds even when the public site opens immediately.
This guide shows how to fix a slow WordPress admin when the frontend is fast. The method is measurement-first: capture the slow request, match it to server evidence, isolate the responsible layer, and make the smallest safe correction. Success means representative admin work is faster in a fresh session without breaking publishing, orders, forms, scheduled jobs, or logged-out pages.
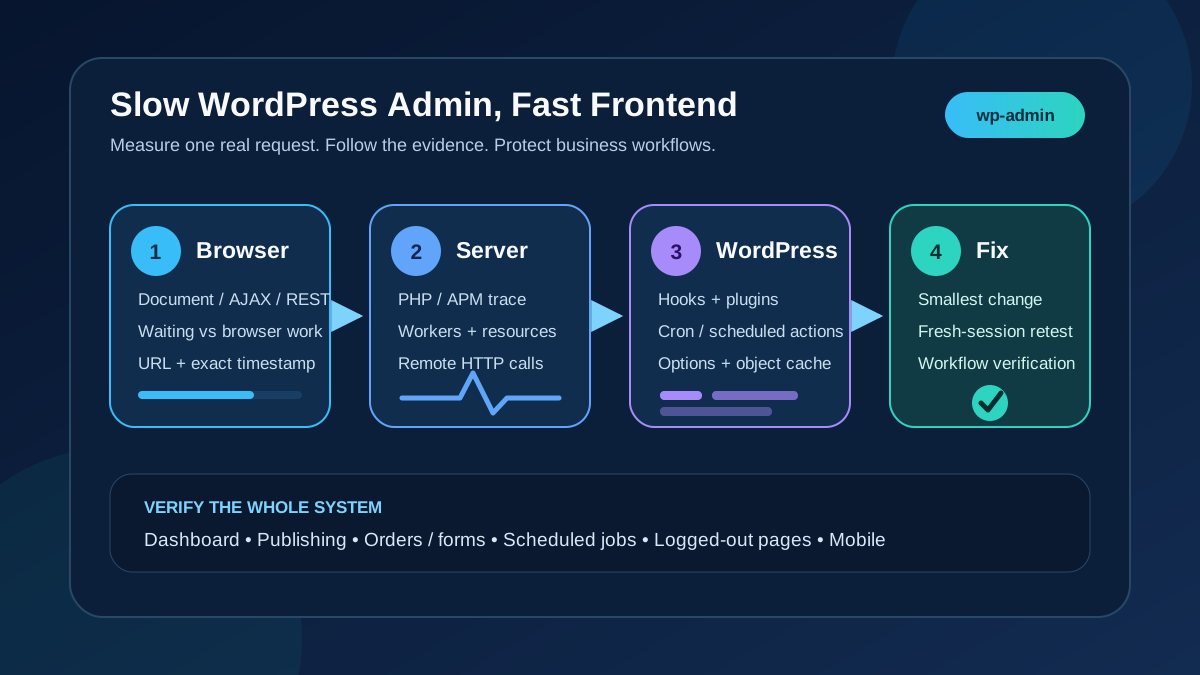
Quick answer: Open the browser Network panel, reproduce one slow admin action, and record its URL, status, waiting time, response size, and exact time. A slow document, REST, or admin-ajax.php response points to PHP, plugins, database, cron, external HTTP calls, or worker capacity; a fast response followed by a frozen screen points to browser-side JavaScript. Correlate the request with PHP/server logs or an APM trace, test one suspect at a time on staging, and repeat the same workflow after each change.
Use the slow request as your triage map
| Evidence | Likely layer | First useful check |
|---|---|---|
| Initial admin document has long waiting/TTFB | PHP, plugin hooks, database, cron, remote call, or worker queue | Match the URL and timestamp in APM and server logs |
admin-ajax.php repeats or takes seconds | Heartbeat or a plugin AJAX action | Inspect the request’s action, initiator, payload, and response |
A /wp-json/ request is slow | A specific REST route or its permission/data callbacks | Record the route, method, status, and server trace |
| Network finishes quickly but the screen freezes | Admin JavaScript, DOM work, or a browser extension | Record a browser Performance trace and test a clean profile |
| All PHP requests slow only during busy periods | PHP worker saturation, CPU, memory, I/O, or database contention | Check request queues, active workers, resource graphs, and slow logs |
| Only one list or edit screen is slow | Screen-specific plugin hook, query, columns, metabox, or remote data | Compare that screen with a simple dashboard request |
| Delay appears at regular intervals | WP-Cron, Action Scheduler, backups, scans, imports, or reports | Compare the timestamps with scheduled jobs and their logs |
Protect the site and establish a repeatable baseline
Create a restorable database-and-files backup, then reproduce on production-like staging when possible. Staging needs similar data volume, plugins, PHP, cache, and scheduled workload; an empty clone can hide the problem. Record the software stack, must-use plugins, drop-ins, host plan, and the time zone used by every log.
- Choose three representative actions: load the dashboard, open a large content list, and edit or save a real item.
- For a store or membership site, add a low-risk order, subscription, booking, or user-management view.
- Run each action three times in the same role and browser, noting cold and warm results separately.
- Record median response time rather than selecting the fastest attempt.
- Preserve a before-change screenshot or export from the browser waterfall and APM trace.
Do not begin by disabling every plugin, clearing every cache, deleting database rows, or increasing all PHP limits. Those changes erase attribution and can interrupt checkout, webhooks, scheduled emails, imports, backups, or publishing locks. Make one reversible change against a recorded baseline.
1. Capture the browser request that is actually slow
Open developer tools, select Network, preserve the log, and reload the affected admin screen. The official Chrome Network reference explains the waterfall and request Timing view. Record the slow request’s method, final URL, status, type, initiator, response size, and Timing breakdown. Redact cookies, nonces, personal data, and private content before sharing an export.
Separate server waiting from browser work
If most time is spent waiting for the first response byte, investigate the origin request. Large download time suggests an oversized response. If requests complete promptly but clicks or typing remain delayed, record the browser Performance panel and test a private profile with extensions disabled. That prevents a browser extension or admin JavaScript loop from being misdiagnosed as a database problem.
Do not stop at the first admin-ajax.php name. Many features share that endpoint. Inspect the form payload for an action value and the Initiator column for the responsible script. REST requests are similar: the route after /wp-json/, HTTP method, and response identify the operation far better than the generic API hostname.
2. Correlate the request with PHP, server, and APM evidence
Reproduce once at a recorded time and give the host or application monitor the URL path, action, timestamp, and time zone. A useful transaction trace breaks the request into WordPress hooks, PHP functions, database calls, and external services. A PHP warning near the delay is a lead, not proof.
WordPress documents temporary logging and SAVEQUERIES in its debugging guide. Use those tools on staging or for the shortest controlled production window, keep display output off, and restore the original configuration. SAVEQUERIES adds overhead and stores query call data in memory, so it is not a permanent performance setting.
Profile WordPress bootstrap when command-line access is available
The official WP-CLI profile command can measure bootstrap, main query, and template stages after its package is installed. It is useful for finding expensive hooks and callbacks, but a command-line profile is not identical to an authenticated browser request. Use the affected URL and user context where supported, and confirm the finding against the real admin transaction.
wp package install wp-cli/profile-command
wp profile stage --all --spotlight --url="https://example.com/wp-admin/edit.php"
3. Isolate plugins, the theme, and the affected admin screen
Use staging to test one component at a time. Start with plugins that add columns, filters, metaboxes, dashboards, security scans, analytics, backups, imports, search, ecommerce reports, or remote license checks. A plugin can be fast on public cached pages yet expensive on every authenticated request. Follow a documented WordPress plugin audit so ownership, purpose, update state, and business dependencies are recorded before isolation.
- Measure the failing screen with the full stack.
- Disable one evidence-backed suspect on staging, or use a troubleshooting mode limited to your session.
- Repeat the same URL, role, data set, and action three times.
- Restore the component before testing the next suspect unless the result clearly identifies it.
- Include must-use plugins, drop-ins, and host integrations; normal plugin toggles do not remove them.
Test a default theme only if the theme or child theme attaches admin hooks, metaboxes, custom post-type logic, or ecommerce integrations. For one slow screen, inspect its added columns, filters, and metaboxes first.
4. Diagnose admin-ajax, REST, and Heartbeat without disabling them
The WordPress Heartbeat API polls through AJAX at an interval and supports features such as post locking and near-real-time updates. A repeating heartbeat request is normal. It becomes actionable when its response is consistently slow, its payload is unexpectedly large, or a plugin adds expensive work to every tick.
| Request | Evidence to capture | Safe correction boundary |
|---|---|---|
| Heartbeat in post editor | Interval, duration, response size, screen ID, attached plugin data | Remove or optimize the costly callback; preserve autosave and locking |
Other admin-ajax.php | action, initiator script, payload, response, trace | Fix that named handler rather than blocking the endpoint |
| REST API | Route, method, status, response size, database/HTTP spans | Optimize the route callback or its query and permissions work |
Do not block admin-ajax.php, disable the REST API, or turn off Heartbeat globally. Those endpoints can support editors, widgets, forms, ecommerce operations, and integrations. If a Heartbeat interval is adjusted, test autosave, post locking, session behavior, and the affected plugin feature with two editor sessions.
5. Check WP-Cron and Action Scheduler backlogs
WP-Cron checks due tasks on page loads rather than running continuously. A due backup, scan, feed import, cleanup, or email batch can overlap an admin request. List events without running them:
wp cron test
wp cron event list --fields=hook,next_run_gmt,next_run_relative,recurrence
The WordPress cron handbook explains the page-load trigger, while WP-CLI documents event listing. Look for duplicate hooks, unexpectedly frequent schedules, missed jobs, and timing that matches the slowdown. Use the existing WordPress cron backlog guide for queue-specific repairs.
WooCommerce and other plugins may use Action Scheduler. Its official Scheduled Actions screen exposes pending, failed, and in-progress actions with logs. Do not bulk-run or delete a queue on a live store. Payment renewals, stock updates, webhooks, and customer messages may depend on order and idempotency. Fix the failing hook or runner and process controlled batches after a backup.
6. Measure autoloaded options before editing the database
Autoloaded options are loaded early on WordPress requests. WordPress’s performance guidance notes that excessive autoloaded data can slow a site and gives 800 KB as a general target. Treat that figure as a diagnostic prompt, not permission to delete rows.
wp option list --autoload=on --format=total_bytes
wp option list --autoload=on \
  --fields=option_name,size_bytes,autoload \
  --orderby=size_bytes --order=desc --format=table
These fields and the total_bytes format are documented by WP-CLI option list. Identify the plugin or theme that owns each large option and ask whether it is required on every request. Use the vendor’s migration or cleanup path, test changing autoload behavior on staging, and keep an export of the exact row. Never delete an unknown serialized option because its name looks old.
7. Find repeated or slow database queries
A slow admin list may scan large post-meta, order, user-meta, log, or scheduler tables. Use an APM trace, a staging-only query profiler, or a short database slow-log window to identify exact query shapes. MySQL documents that the slow query log records statements over the configured threshold, and EXPLAIN shows how the optimizer plans a query.
- One individually slow query: inspect rows examined, joins, sorting, temporary tables, locks, and available indexes.
- A fast query repeated hundreds of times: repair the calling loop, cache the result, or batch the lookup.
- Tables far larger than the business data suggests: identify the owner and retention policy before cleanup.
- Lock or I/O waits: correlate with imports, backups, reports, scheduled cleanup, and concurrent writes.
The WordPress database bloat guide covers safe table ownership and cleanup boundaries. Do not add an index copied from another site or run broad table optimization during peak traffic. An index improves specific reads but adds storage and write cost; validate it against the captured query and production-like data.
8. Validate persistent object cache instead of assuming it helps
WordPress’s object-cache reference explains that the default cache lasts only for one request; a persistent backend can reuse expensive data across requests. This can help database-heavy admin work, but only when the Redis or Memcached service, drop-in, key strategy, memory policy, and network path are healthy.
- Confirm the persistent cache is connected and the expected drop-in is active.
- Compare hit/miss and latency evidence before and after the same admin workflow.
- Check eviction, memory pressure, connection errors, and cross-environment key collisions.
- Use a controlled bypass on staging to prove whether the cache improves or worsens the request.
Follow the WordPress object cache and Redis guide for configuration and rollback. Flushing the cache may temporarily change timing, but repeated flushing is not a fix and can create a cold-cache spike.
9. Trace external HTTP calls made inside admin requests
Plugins may contact licensing, updates, analytics, payment, shipping, or AI services while building an admin screen. The WordPress HTTP API provides the common request layer, and the http_api_debug hook fires after a response. A developer can use it briefly on staging to log the host, elapsed time, result, and calling context without credentials or full payloads.
Prove the dependency before blocking it: match the remote hostname and duration in an APM trace, then test a vendor-approved timeout, caching, deferred refresh, or corrected endpoint. Blocking all outbound HTTP can stop updates, license validation, payment or shipping calls, webhooks, and security services.
10. Check PHP workers and shared resource pressure
If unrelated PHP requests slow together, inspect CPU, memory, disk I/O, database connections, and PHP worker capacity for the same window. The official PHP-FPM status documentation describes the listen queue, active and idle processes, slow requests, and whether the maximum child count was reached. Keep any status endpoint restricted to internal or trusted access because it exposes request and capacity information.
A nonzero queue or repeated maximum-worker events supports a capacity problem, but simply raising pm.max_children can exhaust memory or push contention into the database. First shorten the expensive request and move heavy scheduled work away from interactive traffic. Then size workers from measured per-process memory, available RAM, traffic concurrency, and database capacity with the host.
Apply the smallest fix that matches the evidence
| Proven cause | Smallest durable fix | Rollback |
|---|---|---|
| One slow admin hook or plugin callback | Update, patch, reconfigure, or remove that callback with vendor support | Restore the prior version/configuration |
| Duplicate or stuck scheduled job | Correct its recurrence/runner and process safe batches | Restore event export and plugin configuration |
| Oversized autoloaded option | Use the owner’s cleanup path or change only its justified autoload state | Restore the exported option exactly |
| Repeated/slow query | Correct the caller, retention policy, or validated index | Revert code/index and restore affected data |
| Slow remote dependency | Cache, defer, correct, or bound the named call | Restore request behavior and monitor vendor status |
| Worker queue after code optimization | Right-size workers and resources from observed demand | Restore pool settings and reload safely |
Verify admin speed and business workflows
- Open a fresh private session, sign in with the affected role, and repeat the same three measured admin actions.
- Compare median document, AJAX, and REST timings with the saved baseline; confirm the slow trace or query is gone.
- Publish or update a test item, upload media, use search and filters, and confirm autosave and post locking.
- On commerce or membership sites, test a low-risk order, payment sandbox, webhook, scheduled action, email, inventory, booking, or subscription workflow as applicable.
- Check a mobile admin view for the original task, then test logged-out public pages and forms on desktop and mobile.
- Review PHP, server, database, cron, Action Scheduler, and object-cache logs for new warnings, backlogs, or error spikes.
- Observe through at least one normal busy period or scheduled-job cycle before closing the change.
The repair is complete when: the same admin workflows are consistently faster in a fresh session, the captured bottleneck no longer dominates the trace, background queues remain healthy, and publishing plus revenue-critical workflows pass without relying on repeated cache purges or blanket feature disabling.
Prevent slow wp-admin from returning
- Track admin transaction percentiles for a few representative URLs, not only public page speed.
- Alert on PHP worker queues, database slow queries, failed scheduled actions, and growing job backlogs.
- Review autoloaded option size, large tables, and plugin ownership during scheduled maintenance.
- Load-test imports, reports, backups, scans, and bulk edits on staging with production-like data.
- Keep a rollback note for plugin, database, object-cache, cron, and PHP pool changes.
- Recheck after WordPress, PHP, ecommerce, security, and performance-plugin updates.
Frequently asked questions
Why is the frontend fast while wp-admin is slow?
A logged-out page may come from page cache or a CDN without running most PHP and database work. Authenticated admin pages are dynamic, personalized, and usually bypass full-page cache, so plugin hooks, queries, remote calls, scheduled jobs, and worker queues remain visible there.
Will increasing the WordPress memory limit fix a slow dashboard?
Only evidence of memory exhaustion or a justified workload supports that change. More memory does not repair a slow remote call, repeated query, blocked worker, or JavaScript loop. It can also allow each worker to consume more RAM and reduce safe concurrency.
Should I disable WordPress Heartbeat?
No, not as a blanket fix. First prove that a Heartbeat request is slow and identify the callback adding the work. Global disabling can break autosave, post locking, session features, and plugin behavior. Optimize the responsible callback or make a tested screen-specific interval adjustment.
Should I run a database cleaner or delete transients?
Not before identifying a measured table, option, or query problem. Cleanup can remove useful data or merely create a temporary cold-cache change. Back up first, identify ownership and retention rules, and use the plugin vendor’s cleanup method on staging.
When should I contact the host?
Contact the host when you can provide a slow URL, exact timestamps and time zone, browser waiting time, reproducible workflow, and relevant APM or log evidence. Ask specifically about PHP queues, worker limits, CPU/memory/I/O pressure, database waits, and slow upstream requests during that window.
Need a measured WordPress admin performance repair?
If the dashboard is slowing publishing, order handling, or client work, AbdullahWP can trace the real request, protect business workflows, and implement a reversible fix. Review the WordPress support and performance services and include the affected screen, user role, approximate delay, and a recent timestamp.